The Oldest & Most Established Luxury Firm in Charlottesville | 48 years in business since 1977
At Frank Hardy Sotheby’s International Realty, we redefine luxury real estate through an unwavering commitment to exceptional service, bespoke marketing, and timeless properties. As a trusted leader in Central Virginia, we curate elevated experiences that go beyond the transaction.
The Overview Central Virginia
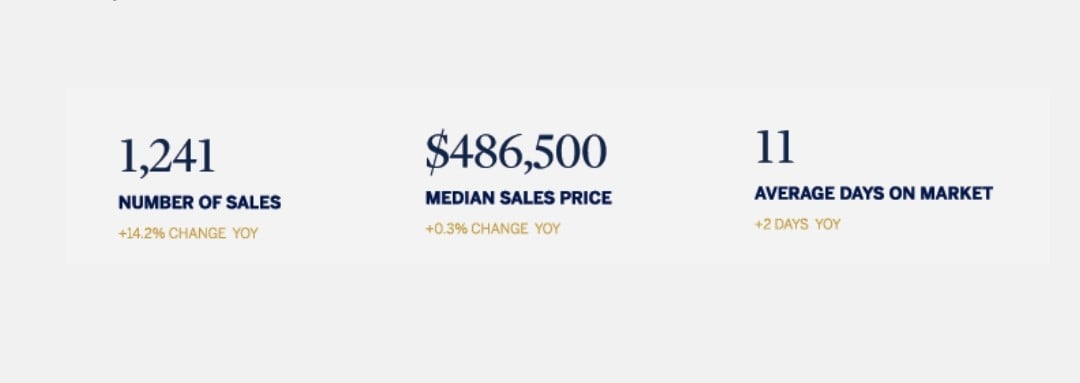
Home sales in the Charlottesville Area Association of REALTORS® (CAAR) surged in the second quarter of 2026, with a total of 1,241 properties sold—a 14% increase from the same time last year. Home prices in the CAAR region are cooling with a home median sales price of $486,500 inching up less than 1% from Q2 2025. Despite the cooling prices, sellers continue getting close to asking price.
Inventory levels expanded significantly, providing more options for buyers. The region closed the quarter with 1,363 active listings, marking a 32% year-over-year increase. Demand continues to be resilient, with homes spending a median of 11 days on the market. Overall, the 2026 housing market is outpacing the previous year. If listing growth remains strong, this will likely facilitate more sales in the area in the near term.
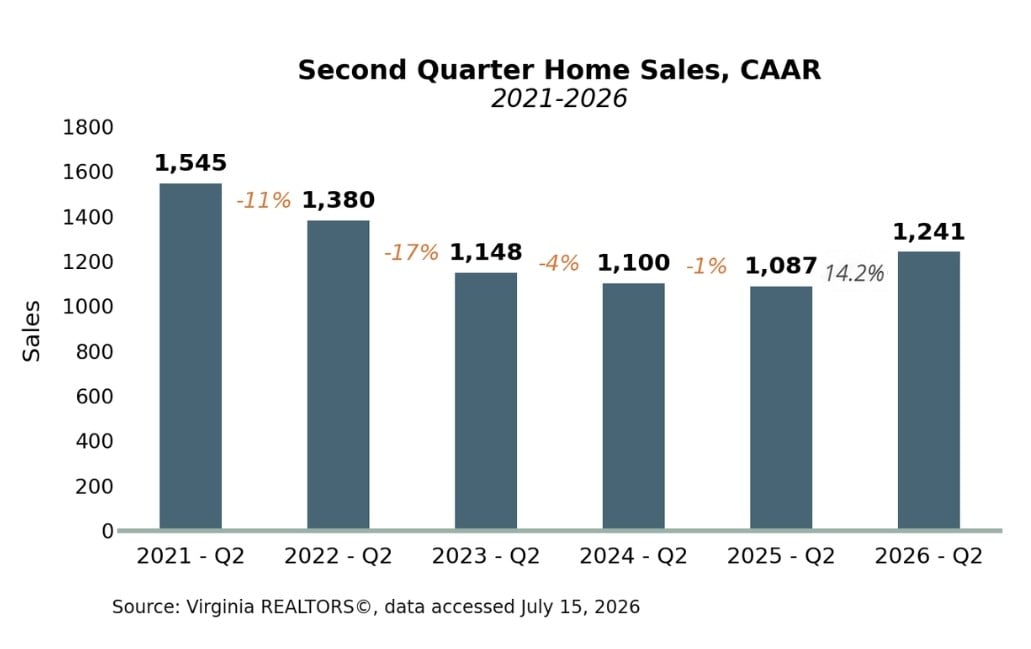
Second Quarter Home Sales 2021 - 2026
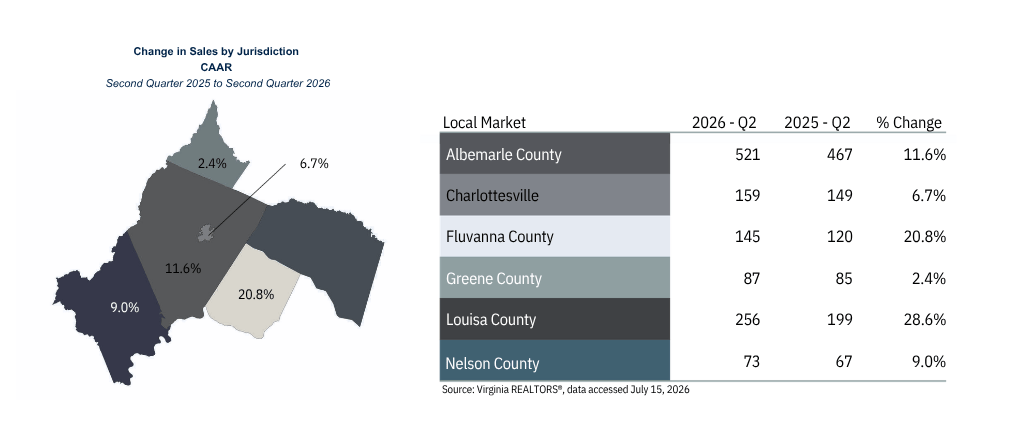
Change in Sales by Jurisdiction
Albemarle County Overview
Sales: The total number of sales in Albemarle County came to 521 in the second quarter, up 11.6% or 54 more sales than a year ago.
Median Sales Price: The second quarter median sales price was $570,000 in Albemarle County, 0.9% lower than last year, a $5,000 price dip.
Sold Dollar Volume: Sold volume grew 16.8% in Albemarle County with a total of $400.2 million in the second quarter, $57.6 million more than the year before.
Active Listings: At the end of the second quarter, there were 539 active listings in Albemarle County, 169 more listings than a year earlier, increasing by 45.7%.
Days on Market: The median days on market was 7 days in Albemarle County, the same duration in the second quarter of this year compared to the previous year.
Charlottesville City Overview
Sales: Sales activity grew 6.7% in Charlottesville with 159 total sales in the second quarter, ten more sales than a year earlier.
Median Sales Price: Home prices fell slightly this quarter. The median sales price was $500,000 in Charlottesville, 1.8% lower than last year, a $9,000 price reduction.
Sold Dollar Volume: There was roughly $97.1 million of sold volume in Charlottesville, $8.3 million less than the year prior, decreasing by 7.8%.
Active Listings: In Charlottesville, the total number of active listings came to 102 at the end of the second quarter, falling by 2.9%, which is three fewer listings.
Days on Market: At 11 days, the median days on market was four days longer in Charlottesville than the previous year.
Fluvanna County Overview
Sales: Home sales increased 20.8% in Fluvanna County with 145 sales in the second quarter, 25 more than last year.
Median Sales Price: The median sales price was $374,000 in Fluvanna County, $11,000 less than the year before, decreasing by 2.9% in the second quarter.
Sold Dollar Volume: In Fluvanna County, there was $60.2 million of sold volume in the second quarter, rising 5.1%, or $3 million of volume.
Active Listings: Listings have increased in Fluvanna County. The second quarter ended with 152 listings on the market, 54 more than a year ago, a 55.1% jump in activity.
Days on Market: Fluvanna County’s median days on market was 12 days in the second quarter, 2 days longer than the previous year.
Greene County Overview
Sales: In Greene County, there were 87 home sales in the second quarter, 2 more sales than last year, an 2.4% growth in activity.
Median Sales Price: At $418,980, the median sales price in Greene County was $13,452 lower than the year before, decreasing by 3.1%.
Sold Dollar Volume: There was an 2.6% increases in sold dollar volume in Greene County bringing the total amount to $39.0 million in the second quarter, $1 million more than the previous year.
Active Listings: The total number of listings bumped to 92 in Greene County at the end of the second quarter, 15.0% higher than last year, which is 12 additional listings.
Days on Market: In Greene County, the median days on market was 6 days, or the same duration the same time a year ago.
Louisa County Overview
Sales: Louisa County had 256 sales in the second quarter of the year, 57 more sales than the previous year, gaining 28.6%.
Median Sales Price: Prices decreased by 1.2% in the second quarter, bringing the median price to $439,700 in Louisa County, $5,300 less than last year.
Sold Dollar Volume: At $139.3 million, sold volume in Louisa County was $24.9 million higher than a year ago, representing a 21.7% rise in volume.
Active Listings: There were 62 additional listings on the market in Louisa County as the second quarter ended with 346 total listings, increasing by 21.8%.
Days on Market: Homes sold in Louisa County sold two days slower with the median days on market at 23 days in the second quarter.
Nelson County Overview
Sales: The year ended with 73 sales in Nelson County, 6 more sales than the year before, increasing by 9% in the second quarter.
Median Sales Price: There was a $20,000 price drop in Nelson County with the median price of homes at $415,000 in the second quarter, 4.6% less than a year earlier.
Sold Dollar Volume: Sold dollar volume totaled $35.1 million in Nelson County, an increase of 7.6% or $2.5 million from the previous year.
Active Listings: Nelson County had 132 listings at the end of the second quarter, up 36.1% from the previous year, an additional 35 listings.
Days on Market: For homes sold in Nelson County, the median days on market was 23 days in the second quarter, nine days longer than last year.
Ann Hay’s Feedback
As we close the second quarter, the Charlottesville and Central Virginia market is showing encouraging signs of renewed activity. Every local market within the CAAR area experienced sales growth, with Albemarle County among the strongest at 12% and Charlottesville posting a 7% increase. Sales activity during the first half of the year has been the strongest since 2022, potentially reflecting continued employment growth in the region as well as the greater selection of homes brought to market during the spring season.
Sales prices and mortgage rates have remained relatively steady, creating a market defined more by measured movement than significant shifts. As we look toward the second half of the year, continued sales growth could provide further momentum heading into the fall, particularly if mortgage rates remain favorable. For buyers, this evolving market offers an opportunity to approach the season with greater choice and thoughtful consideration.